Animated Data Vis & Infographic Design
Data is only as powerful as your ability to communicate it. Transform your spreadsheets and complex statistics into clear, cinematic animations that make your insights impossible to ignore.

Uses
Financial Reporting: Animating annual growth and market trends.
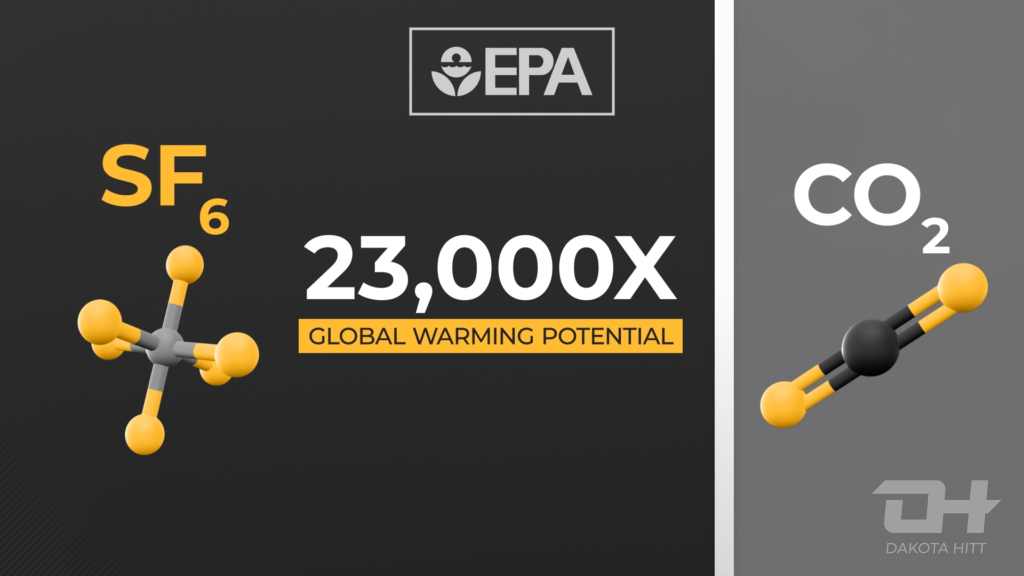
Scientific & Medical Visualization: Explaining complex systems through 3D motion.
Interactive UI/UX Animation: Showing how data moves within an app interface.
The Process
Step 1: Debrief
We discuss your requirements, files, mood boards, and style.
Step 2: Style Frames
Before animation, I’ll send static style frames to confirm the look, color palette, and level of detail matches your vision and brand.
Step 3: Animation
I bring the frames to life with smooth camera moves, dynamic labeling, and sound design-ready motion. Depending on the scope and timeline of the project, you can expect to receive at least one preview in this step – just to ensure I’m on the right track and as an opportunity for you to provide feedback.
Step 4: Final Delivery
You receive a high quality, ready to use file (ProRes, MP4, or your preferred file type).